
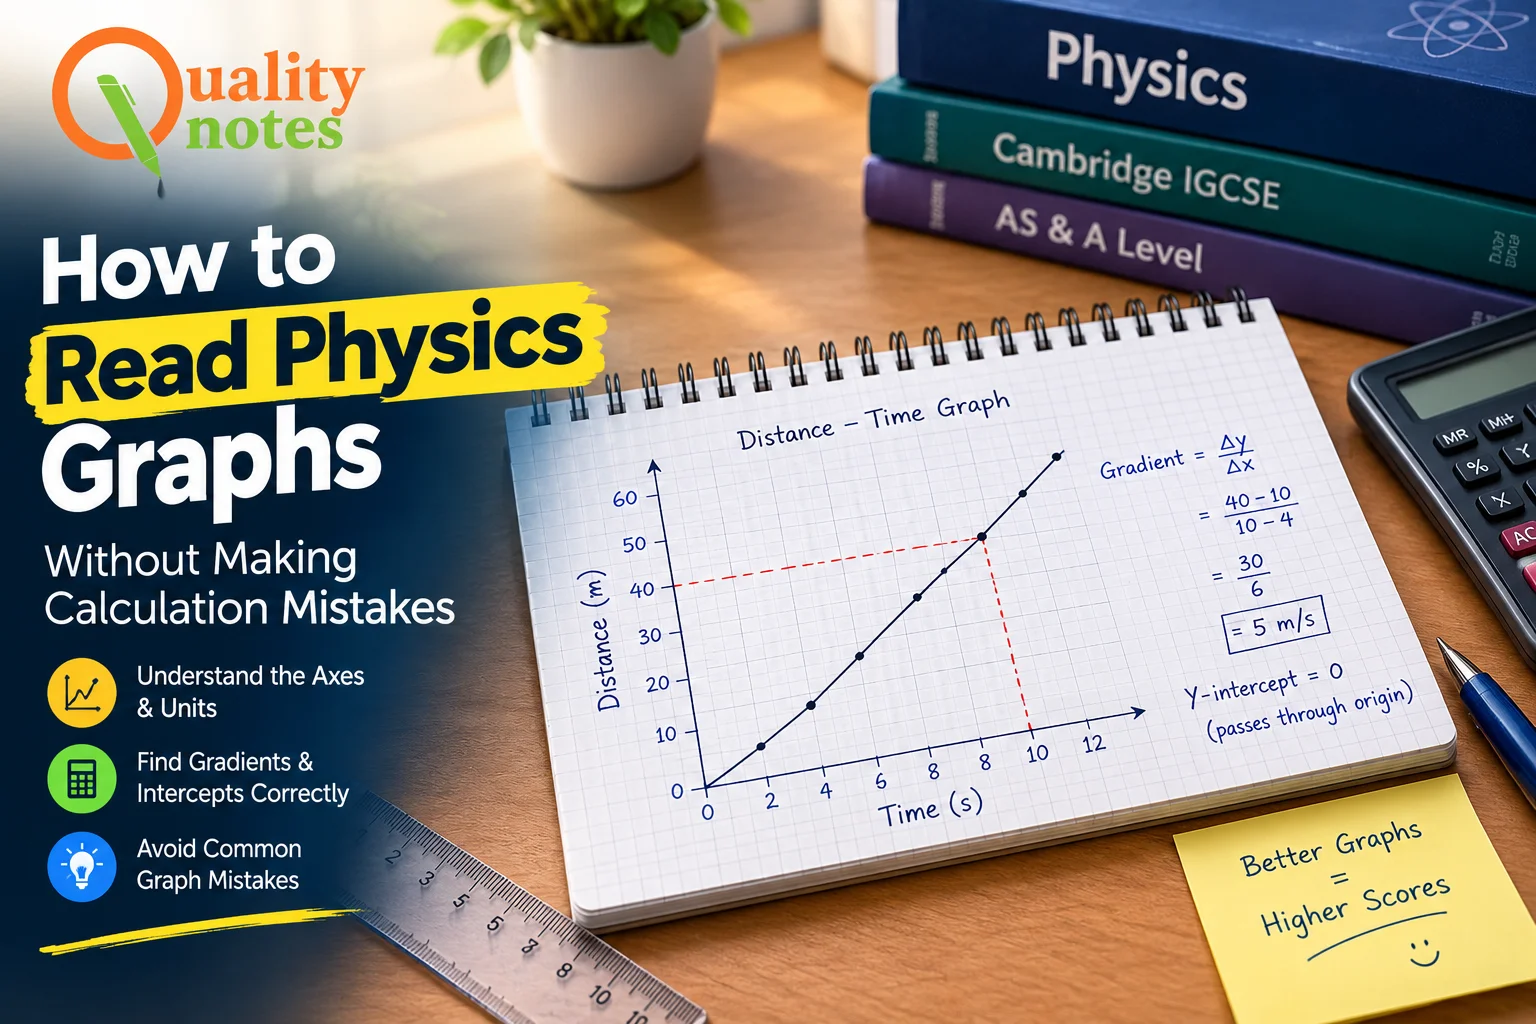
How to Read Physics Graphs Without Making Calculation Mistakes
To read physics graphs accurately, first check the title, axis labels, units, scale and plotted points before calculating anything. Never assume that one large square equals one unit; calculate the value represented by each division. For a gradient, choose two clear points that are far apart and use the change in the vertical quantity divided by the change in the horizontal quantity. Then check the units and decide whether the gradient or intercept has a physical meaning. In experimental questions, also pay attention to error bars, best-fit lines and uncertainty. Most graph mistakes happen because students rush into calculations before understanding what the graph represents.
Why You Make So Many Mistakes When You Read Physics Graphs
A physics graph is more than a picture showing whether one quantity increases or decreases. It can provide numerical information about relationships between physical quantities, experimental results, constants, rates of change and uncertainties.
Many students understand the physics behind a question but lose marks because they misread the graph. A wrong scale, incorrect point, missing unit, or poor gradient calculation can change an otherwise correct answer.
The good news is that most read physics graphs mistakes are avoidable.
The key is to use the same checking process every time.
Before calculating anything, ask:
- What quantity is on the horizontal axis?
- What quantity is on the vertical axis?
- What are their units?
- What does each small division represent?
- Is the graph straight or curved?
- Are there error bars?
- Am I being asked for a value, gradient, intercept, or uncertainty?
This short checklist prevents many avoidable errors.
How to Read Physics Graphs Step by Step
When you read physics graphs, do not begin by immediately selecting numbers and putting them into a formula. Start by understanding the graph as a whole.
Step 1: Read the axis labels
The horizontal axis normally represents the independent variable, while the vertical axis normally represents the dependent variable.
For example, if a graph shows distance against time:
- Horizontal axis: time
- Vertical axis: distance
This distinction matters because changing the order of the axes changes the meaning of the gradient.
Step 2: Check the units
Units are part of the information given by a graph.
If time is measured in milliseconds rather than seconds, you need to account for that before using the value in a calculation.
For example:
500 ms = 0.500 s
Ignoring this conversion can produce an answer that is wrong by a factor of 1000.
Step 3: Examine the scale
Look carefully at the numbers printed beside the axes.
Suppose the vertical axis goes from 0 to 10 N over five large squares. Each large square represents 2 N.
If there are ten smaller divisions between 0 and 10 N, each small division represents 1 N.
Never assume the scale is 1, 2, 3, 4 simply because the numbers look evenly spaced.
Step 4: Identify what the graph is showing
A straight upward line means the vertical quantity increases as the horizontal quantity increases.
A horizontal line means the vertical quantity remains constant.
A downward slope means the vertical quantity decreases as the horizontal quantity increases.
A curve means the rate of change is not constant.
This interpretation should come before calculation.
Check the Axes Before Doing Any Calculation
One of the safest ways to read physics graphs is to treat the axes as part of the question rather than as decoration.
Consider a graph of force against extension. If force is on the vertical axis and extension is on the horizontal axis, the gradient is:
gradient = change in force/change in extension
The units would therefore be N m⁻¹ if extension is measured in meters.
But if the axes were reversed, the gradient would have different units and a different physical meaning.
Always write the quantities beside your calculation before substituting numbers.
For example:
Gradient = Δy / Δx
Then identify:
Δy = change in vertical quantity
Δx = change in horizontal quantity
This simple habit reduces many calculation mistakes.
Understand the Scale and Small Divisions
Scale errors are among the most common graph-reading mistakes.
Imagine the horizontal axis is labeled:
0, 2, 4, 6, 8, 10
and there are four equal small divisions between 0 and 2.
The value of one small division is:
2 ÷ 5 = 0.4
The important point is that you must count the intervals, not simply count the printed numbers.
A graph can also use awkward scales such as 0.2, 0.4, 0.6 or 50, 100, 150. Take a few seconds to work out the scale before reading a point.
If the graph is poorly scaled or the labels are difficult to read, estimate carefully and state an appropriate number of significant figures.
How to Calculate a Gradient Correctly
To read physics graphs properly, students must be comfortable with gradients.
The basic formula is:
Gradient = (y₂ − y₁) / (x₂ − x₁)
The safest method is to choose two points that are easy to read and reasonably far apart.
Do not automatically use two nearby plotted points. Small reading errors become much more significant when the points are too close together.
Example
Suppose a straight-line graph passes through:
- Point A: x = 2 s, y = 6 m
- Point B: x = 8 s, y = 18 m
Then:
Gradient = (18 − 6) / (8 − 2)
Gradient = 12 / 6
Gradient = 2 m s⁻¹
The units are obtained by dividing the vertical axis units by the horizontal axis units.
Why should you use points far apart?
If you select two points that are very close together, reading the graph to the nearest division can create a relatively large percentage error.
Using points farther apart generally gives a more reliable estimate of the gradient, provided both points lie on the relevant line.
What Does the Gradient Mean?
A gradient is not just a number.
Its physical meaning depends on the quantities plotted on the axes.
For example:
| Graph | What the Gradient May Represent |
|---|---|
| Distance against time | Speed |
| Velocity against time | Acceleration |
| Force against extension | Spring constant |
| Current against voltage | Conductance |
| Voltage against current | Resistance |
| Momentum against velocity | Mass |
The exact interpretation depends on which variable is on each axis.
That is why memorizing “gradient = answer” isn’t enough. You need to connect the gradient to the physics.
After calculating a gradient, ask:
What physical quantity does this gradient represent?
Then check whether your units make sense.
How to Find the Y-Intercept
The y-intercept is the value of the vertical variable when the horizontal variable is zero.
For a straight-line equation:
y = mx + c
where:
- m = gradient
- c = y-intercept
For example, if:
y = 3x + 5
then the gradient is 3 and the y-intercept is 5.
In experimental physics, the intercept can sometimes provide useful information about an initial value, systematic error, or physical constant.
Do not assume the line must pass through the origin simply because the relationship looks proportional.
A proportional relationship should pass through the origin. Still, an experimental graph may show an offset because of measurement limitations or other physical effects.
Reading Curves, Tangents and Best-Fit Lines
Not every graph contains a straight line.
When a graph is curved, the gradient changes from one location to another.
If you need the gradient at a particular point, draw a tangent to the curve at that point.
A tangent is a straight line that touches the curve locally and represents its instantaneous gradient at that position.
Then calculate:
Gradient of tangent = Δy / Δx
Make the tangent as accurate as possible. It should follow the direction of the curve at the selected point rather than simply touching it at an arbitrary angle.
Best-fit lines
Experimental data rarely form a perfectly straight line through every point.
Instead, you may need to draw a line of best fit.
A good best-fit line should:
- Follow the overall trend of the data.
- Have approximately balanced points above and below the line.
- Avoid being forced through every experimental point.
- Not be drawn through the origin unless the physics requires it.
When you read physics graphs containing experimental data, remember that the best-fit line represents the overall relationship, not necessarily every individual measurement.
Graphs With Error Bars and Uncertainty
Error bars show the possible range associated with a measured value.
For example, if a measurement is:
5.0 ± 0.2 cm
the result may reasonably lie between:
4.8 cm and 5.2 cm
When comparing two experimental points, overlapping error bars may indicate that the difference between the measurements is not clearly significant.
In practical Physics questions, you may also be asked to determine uncertainty from maximum and minimum gradients.
A common approach is to calculate:
Percentage uncertainty = (absolute uncertainty / measured value) × 100%
The exact method depends on what information the question provides, so always follow the wording and required method.
Common Read Physics Graphs Mistakes
Knowing what not to do is just as important as knowing what to do.
1. Using the wrong axis
Students sometimes calculate x/y instead of y/x.
Fix: Always write “vertical change ÷ horizontal change.”
2. Misreading the scale
A student may think each small square equals 1 unit when it actually equals 0.2 units.
Fix: Calculate the value of one division before reading points.
3. Choosing points too close together
This makes small reading errors more important.
Fix: Use two well-separated points on the line.
4. Forgetting units
A numerical answer without appropriate units may be incomplete.
Fix: Write the units beside each quantity before calculating.
5. Using a random point on a curve
A point on a curve does not automatically give its gradient.
Fix: Draw a tangent when an instantaneous gradient is required.
6. Forcing the line through the origin
Experimental data do not always produce a zero intercept.
Fix: Follow the data and the physical relationship.
7. Rounding too early
Premature rounding can slightly change the final answer.
Fix: Keep extra digits during calculations and round at the end.
8. Ignoring negative signs
A downward gradient is negative.
Fix: Keep the sign unless the question specifically asks for magnitude.
A Reliable Exam Method
A simple method can make graph questions much easier.
When you read physics graphs in an examination, use this sequence:
1. Read the question carefully.
Identify exactly what the examiner wants.
2. Inspect both axes.
Write down the quantities and units.
3. Determine the scale.
Work out the value of each major and minor division.
4. Identify the graph type.
Decide whether it is straight, curved, or experimental data requiring a best-fit line.
5. Select appropriate points.
For a gradient, use two well-separated points on the relevant line.
6. Perform the calculation.
Use:
gradient = Δy / Δx
7. Check the units.
Make sure the units match the physical quantity.
8. Check the answer for reasonableness.
Ask whether the magnitude and sign make physical sense.
This process takes only a little extra time but can prevent several avoidable errors.
How Practice Improves Read Physics Graphs Skills
Graph interpretation becomes easier through repeated practice.
Instead of solving only complete examination papers, practice different graph skills separately:
- Reading scales
- Finding coordinates
- Calculating gradients
- Finding intercepts
- Drawing tangents
- Drawing best-fit lines
- Interpreting error bars
- Calculating percentage uncertainty
- Identifying physical relationships
- Explaining what a gradient represents
Topical practice is especially useful because it allows you to recognize recurring question patterns.
Quality Notes provides structured Physics learning resources, including topical past-paper workbooks, revision materials, recorded lessons and solved questions for Cambridge IGCSE, AS and A-Level Physics.
Students can use these resources to move from understanding a graph technique to applying it under examination conditions.
Quick Read Physics Graphs Checklist
Before submitting a graph calculation, ask:
| Check | Question |
|---|---|
| Axes | Did I identify the x and y axes correctly? |
| Units | Did I include the correct units? |
| Scale | Did I calculate each division correctly? |
| Points | Did I choose suitable points? |
| Gradient | Did I use Δy ÷ Δx? |
| Curve | Did I use a tangent if required? |
| Best Fit | Did I follow the overall trend? |
| Sign | Does the positive or negative sign make sense? |
| Rounding | Did I round only at the end? |
| Physics | Does the final result make physical sense? |
Final Thoughts
Learning to read physics graphs correctly is an essential skill for Physics students because graphs can turn experimental data into meaningful physical information. The safest approach is simple: understand the axes, check the scale, identify the relationship, calculate carefully, include units and always ask what the result means physically.
Do not treat graph questions as pure mathematics. The calculation is only one part of the task. The real skill is connecting the shape, gradient, intercept, units and experimental uncertainty to the underlying Physics.
If you want structured support as you develop these skills, Quality Notes is worth exploring. Its Cambridge-focused resources include revision notes, topical past papers, recorded lessons and solved examination questions designed to help students strengthen both conceptual understanding and exam technique.
With regular practice and a consistent checking method, graph questions become much less intimidating and calculation mistakes become far easier to avoid.